Implementing QuantileTransformer in Spark - mapping any kinds of distribution to normal distribution
23 Mar 2023This blog post is motivated by the Scikit-learn documentation of QuantileTransformer and a StackExchange discussion thread about it.
There are 2 parts in this post. Part I reviews the idea of Quantile Transformer. Part II shows the implementation of Quantile Transformer in Spark using Pandas UDF.
Part I: Quantile Transformer transforms data of arbitrary distribution to normal (or uniform) distribution
Problem Statement: I have some individuals (id) with 3 attributes of different distributions. I want to combine them linearly and also want to make sure the outcome follows a normal distribution.
In python, I create a toy dataset with column id, and 3 columns corresponding to random variables following different distributions:
import numpy as np
import pandas as pd
import scipy
import math
import matplotlib.pyplot as plt

num_of_items = 10000  # the size of my population

df = pd.DataFrame({
    'id': [str(i) for i in np.arange(num_of_items)],
    'uniform': np.random.rand(num_of_items),
    'power_law': np.random.power(3, num_of_items),
    'exponential': np.random.exponential(1, num_of_items)})
The first 5 rows of df looks like
 id   uniform  power_law  exponential
  0  0.543253   0.690897     0.523969
  1  0.161339   0.802748     0.808497
  2  0.487836   0.818129     1.409843
  3  0.594641   0.808148     2.233953
  4  0.513764   0.783795     1.841159
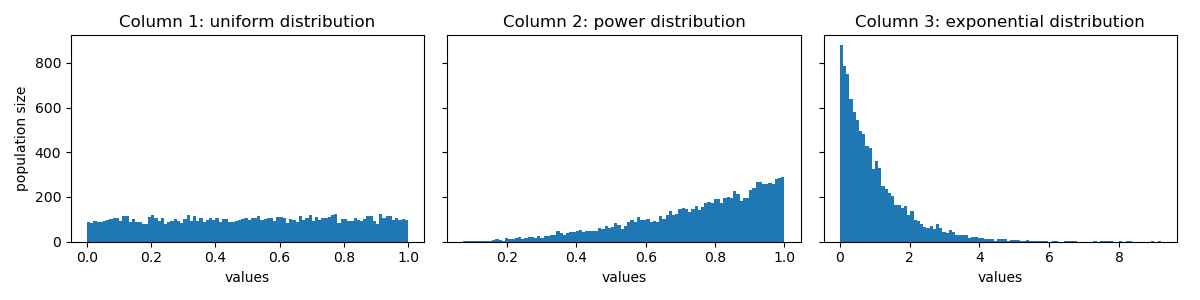
Here is a visualization of their distributions:
To transform all the columns to normal distribution, first, get the rank (or quantile, if rank is too expensive) for each id in each column:
df_rank = df.rank(
    axis=0, method='average', numeric_only=True, na_option='keep', ascending=True, pct=True)
The first 5 rows of df_rank looks like:
   uniform  power_law  exponential
0   0.5351     0.3388       0.4099
1   0.1544     0.5243       0.5543
2   0.4814     0.5546       0.7586
3   0.5882     0.5351       0.8950
4   0.5053     0.4885       0.8427
Let’s say we want to map these values to a normal distribution with mean=0.5 and standard deviation=0.15. To look up the corresponding value in the CDF of normal distribution, we can use scipy.stats.norm.ppf:
df_transformed = df_rank.applymap(lambda col: scipy.stats.norm.ppf(col, loc=0.5, scale=0.15))
The first 5 rows of df_transformed looks like:
    uniform  power_law  exponential
0  0.513214   0.437639     0.465830
1  0.347339   0.509142     0.520480
2  0.493004   0.520594     0.605271
3  0.533438   0.513214     0.688035
4  0.501993   0.495675     0.650843
Let’s see how the distribution of values in df_transformed look like:
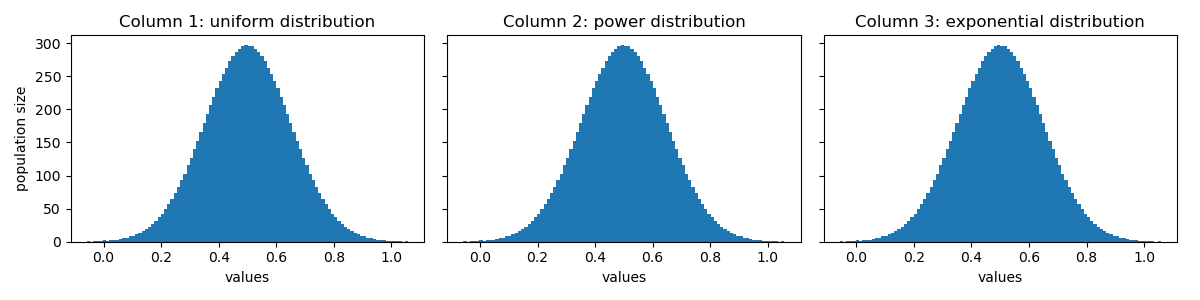
Perfect! Their distributions look identical now! 😝
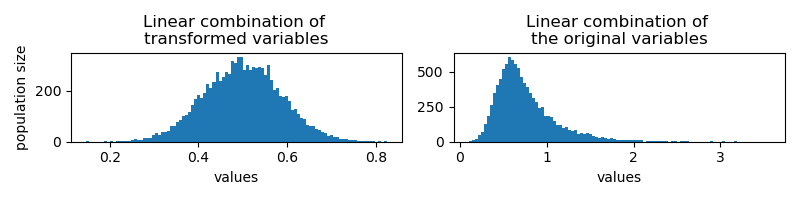
If I do a uniform linear combination of them per id,
df_transformed['linear_combination'] = df_transformed.apply(
    lambda row: np.mean([row['uniform'], row['power_law'], row['exponential']]), axis=1)
I would get results of the same distribution. On the right, I show the results from linear combination of the original values for comparison:
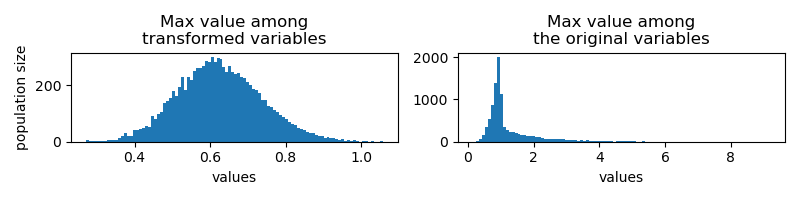
Another combination strategy would be to get the max value among the 3 columns. The transformed variable follows similar distribution, dispute the mean shifts to larger values.
Part II: Implementation of Quantile Transformer in Spark
Given the introduction of Pandas UDF in Spark, the implementation is relatively simple. If ranking is too expensive, you can consider using approximate quantile instead.
from pyspark.sql.functions import pandas_udf, PandasUDFType

@pandas_udf(PandasUDFType.SCALAR)
def to_normal_distribution(data: pd.Series):
    pdf = data.rank(pct=True)\
        .applymap(lambda col: scipy.stats.norm.ppf(col, loc=0.5, scale=0.15))
    return pdf
(Note: Later I realized that the newest Spark version has pyspark.pandas.DataFrame.rank, see Spark documentation. That’s not available at my work station yet.)
You can append the transformed value to the original dataframe:
spark_df = spark_session.createDataFrame(df)
spark_df = spark_df.withColumn(
    'transformed_data',
    to_normal_distribution(spark_df.uniform))